Multiple Choice
Identify the choice
that best completes the statement or answers the question.
|
|
|
1.
|
The table below shows the relative amount of
elements in soil from the moon.
Which graph best shows the data from the table?
|
|
|
2.
|
The table shows the average distance from the
sun to the planets Mercury, Venus, and Earth.
Which graph best compares the distances from the sun for these three
planets?
|
|
|
3.
|
| Scale Reading | Wind Speed (km/h)
| Damage levels | | 0 | 116 | Light | | 1
| 116-180 | Moderate | | 2
| 181-253 | Considerable | | 3
| 254-332 | Severe | | 4
| 333-419 | Devastating | | 5 | 419 | Incredible | | | |
According to the chart provided, how much precipitation is produced in a
considerable tornado such as a scale 4 or 5 tornado?a. | 12-plus centimeters of rain | b. | can not be determined from this
data | c. | 1 to 5 plus centimeters of rain |
|
|
|
4.
|
A beaker containing 50 mL of water is being heated
from 20ºC to 50ºC, and during the heating time the rising temperature is recorded every two
minutes.
Which table shown below is best suited for recording the data?
|
|
|
5.
|
A student took a field trip on a bus. The student recorded the distance traveled
by the bus every 10 minutes for one hour. The student’s data are shown below. Which line best represents
the data from the table?
|
|
|
6.
|
The graph shows a rabbit population that
has increased due to the lack of predators.
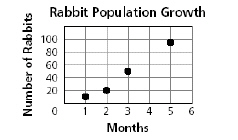
Which table below correctly displays the population data?
|
|
|
7.
|
A student wanted to
determine if the mass of a marble has any connection to the depth of the crater created when the
marble is dropped onto wet sand.
Marble Dropping
Investigation | Marble | Marble Mass | Height
Dropped | Crater Depth | | 1 | 18
g | 2 m | 2 mm | | 2 | 20
g | 2 m | 4 mm | | 3 | 21
g | 2 m | 5 mm | | 4 | 23
g | 2 m | 7 mm | | | | |
Select the statement below that best matches the data shown in the table.
a. | Deeper craters were created
with higher mass marbles than lower mass marbles. | b. | Marbles 1 and 3 created deeper craters than marble
2 and 4. | c. | The student should have dropped the marbles from different heights each
times. |
|
|
|
8.
|
The fuel efficiency of four different cars is shown in the table
below.
Fuel Efficiency
Data | Car | Fuel Efficiency
(miles per
gallon) | W | 21 | X | 29 | Y | 16 | Z | 42 | | |
Which graph
below best displays the information from the table?
|
|
|
9.
|
The fuel efficiency of
four different cars is shown in the table below.
Fuel Efficiency
Data | Car | Fuel
Efficiency
(miles per gallon) | W | 21 | X | 29 | Y | 16 | Z | 42 | | |
Cars in the United States are rated according to
the miles traveled per gallons of gas burned which is abbreviated as MPG (miles per gallon). Cars
with higher MPG ratings are more efficient than cars with lower MPG ratings. Understanding
this fact, which answer choice below best matches the data in the table.
a. | Car X has the best fuel efficiency, and car Y has the worst fuel
efficiency. | b. | Car Y has the worst fuel efficiency, and car Z has the best fuel
efficiency. | c. | Car Z has fuel efficiency worse than car Y, but is better than car
W |
|
|
|
10.
|
The table below shows the average rainfall amounts
and number of grazing animals in an area over a 30-year period.
Which is the best conclusion based on the data?
a. | The number of grazing animals increases approximately
every 5 years. | b. | The amount of
rainfall does not affect the number of grazing animals in the area. | c. | The amount of available food increases after years of increased
rainfall. |
|
|
|
11.
|
The table below contains weather data for two
cities.
Which conclusion is best supported by
the data in the table? a. | The coldest temperature for both cities occurs in Dec, Jan, and
Feb. | b. | City X has lower wind speeds than City Y, but City Y has
more rainfall than City X | c. | Bases on their
temperature averages, City X must be closer to the equator than City
Y |
|
|
|
12.
|
The information below shows what happens to
incoming solar radiation
Which pie graph best represents this
information?
|
|
|
13.
|
The graph below shows data collected in an experiment comparing the amount of
water vapor (H 2O), in grams per cubic meter, which was held by air at various
temperatures. Which choice
below is supported by data in this line graph.a. | Air at 10o C can hold more water vapor than air at 50o
C | b. | Warm air cannot hold as much water vapor as cool air | c. | As air temperature
increases, it can hold more water vapor. |
|
|
|
14.
|
Below is data showing the percentages of
populations of beetles that are resistant to three different types of
insecticides.
If population three originally was 100 beetles, how many were killed after
being sprayed by the third insecticide ?
a. | About 65 | b. | All
100 | c. | 34.8 |
|
|
|
15.
|
Scientist measured the movement of tectonic plates relative to one another over
time by placing markers on either side of a fault. The graph below displays the results. Which data set was most
likely used to create the graph?
|